The TeleTrader WebStation is an information platform for institutional users. In addition to real-time quotes and historical data it also offers news and fundamental data as well as charts and technical analysis.
The TeleTrader WebStation is called up with the following link: http://webstation.teletrader.com
To log in, enter the User name and Password that you have received. You must accept the license agreement to start the TeleTrader WebStation.
If you check the option Stay logged in, you don't have to enter your user name and password again when you log in the next time.
To log off, click the button  and choose Logout.
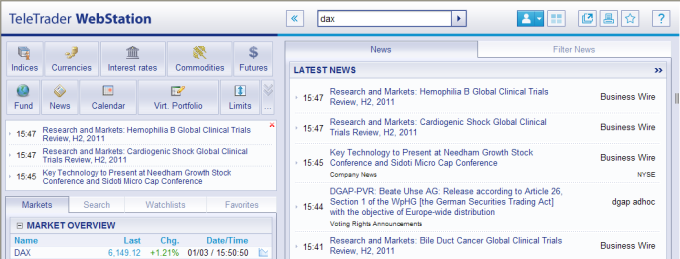
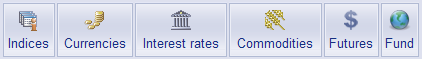
From the navigation bar you can call up various market overviews with one click.
Depending on the type of information displayed, you can call up various detail views: Quote data, charts, news, company profiles, financials and much more. In the Fund area you will see the current top performers which are grouped by various criteria (fund type, region, investment focus).
For each symbol, you can click on the button next to the
symbol name  to perform a
range of actions: For example, to
add the symbol to a personalized watchlist or a virtual portfolio, to copy quote
data, to call up a PDF fact sheet and much more.
to perform a
range of actions: For example, to
add the symbol to a personalized watchlist or a virtual portfolio, to copy quote
data, to call up a PDF fact sheet and much more.
|
|
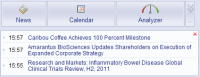
In the navigation bar you can also find overviews of the most current news items in real-time as well as events and forecasts for the current and coming week. The NewsFlash below the navigation bar shows the last news messages and updates dynamically. Important news stories ("breaking news") are highlighted in yellow. In each section you can search directly for news/events or filter them by numerous criteria. |
|
|
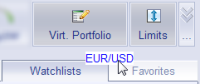
With virtual portfolios you can simulate stock transactions and observe the influence they have on the value of your portfolio(s). Automatically sent e-mail alerts when a specific price limit is reached help you to react quickly to changes in the market. With personalized watchlists you can create your own set of symbols and compare them with one another (including funds). In the Favorites section (Bookmarks), links to the most-often used pages in the TeleTrader WebStation are stored. |
Tip Use the Drag & Drop function to customize your WebStation – drag a symbol to one of the above-mentioned areas and drop it to insert it there!
|
|
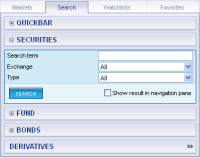
Browse with the QuickBar through symbol lists, search with Securities Search or the Live Search (Ctrl + -) for individual shares or use the special search forms for Funds, Bonds and Derivatives. You can scroll through the search results shown in the navigation area with the arrow keys ← / → . |
|
|
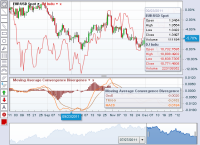
With the Interactive Flash Chart and the GIF Chart you can observe the development of one or more symbols. Chart type, data compression (including tick and intraday charts) and time frame are determined by you. Additionally, you can add indicators and draw on the chart. Drag & Drop: Drag and drop any symbol onto a chart in order to have it overlaid on your chart! |
To configure your TeleTrader WebStation individually, use the following buttons in the title bar:
|
|
Change the global settings of the WebStation, like language, region, time zone etc. You can also choose a personal start page for the WebStation here. |
|
|
Activate the push quotes for dynamically updating overview lists, market depth, times & sales and news. |
|
|
Open the current view in a new browser window. |
|
|
Show / hide the navigation bar with one click. |
|
|
Click here to see other available buttons of the navigation bar. Click on Customize Navigation to add new buttons to the navigation bar or change the button positions (drag & drop). |


For changing table
columns for lists, use the Settings
 button.
The current stock data of a symbol and its historical times & sales data can be exported as Text, CSV File or as an RTD Link.
By using the RTD function, the links in Microsoft Excel are automatically created which you can use to call up stock data in real time (Installation of TeleTrader Professional RTD is required).
Any pages you like can be printed simply by clicking the
Print  button.