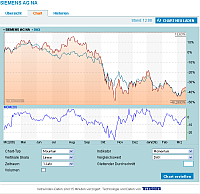
On the sub-page Chart you can use different time compressions and chart types, add indicators and perform simple chart analysis tasks.
- Chart types: Line chart, bar chart, candlestick chart and mountain chart
- Linear, relative (percentage) or logarithmic price scale
- Displayed time period: Intraday, 1 week, 1 month etc. up until 3 years
- Show volume in the chart
- Display the most important indicators in the chart, configurable moving average
- Comparison with an index (available indices are the same as those shown on the overview page)

Like in the overview page, you can reload the chart with current data including all plotted elements.